A year of global temperature as a printed disc
Klimatskivor turns every year since 1940 into a printable disc showing how its days were distributed against pre-industrial temperature. It's a ridgeline chart you can hold, with a QR code on the bottom that links to the exact model.
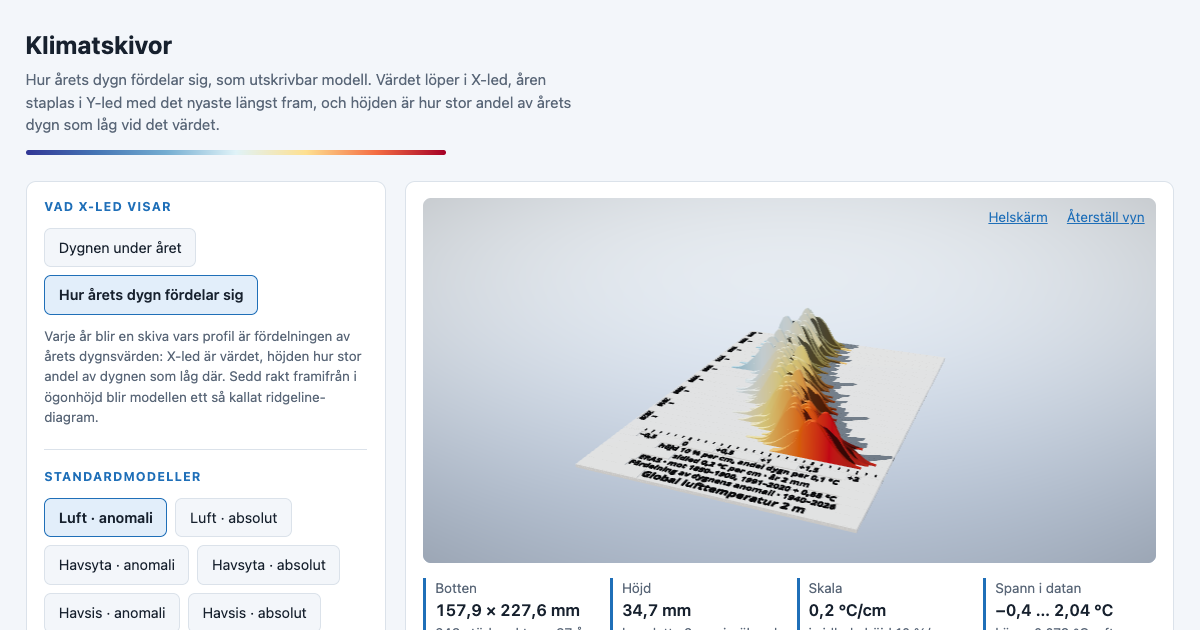
Klimatskivor ("climate discs") makes printable 3D models from daily climate series. Until this week each year was a flat disc with a wavy top edge: the days of the year left to right, temperature as height.
The new default view asks a different question: how were the year's days distributed? Temperature now runs left to right, and height shows how many days of the year landed there. Stack the years front to back and you get the familiar ridgeline chart of daily anomalies (Copernicus publishes one), except that this one is made of plastic. Seen straight on at eye level, the model is that chart.
What the discs show
The reference is now pre-industrial temperature, not 1991–2020. ERA5 starts in 1940, so the pre-industrial level is taken as 1991–2020 plus Copernicus' offset of 0.88 °C. The scale has a heavy mark at 1.5 °C. Counting days of daily global air temperature (ERA5) at or above 1.5 °C:
| Year | Days ≥ 1.5 °C | Mean | |---|---|---| | 2000 | 0 | 0.63 °C | | 2015 | 11 | 1.14 °C | | 2020 | 33 | 1.31 °C | | 2023 | 186 | 1.48 °C | | 2024 | 282 of 366 | 1.60 °C | | 2025 | 154 | 1.47 °C |
On the model, those years stand to the right of the mark, and the older discs cluster well to the left of it. The 0.88 °C offset is meant for annual means, so applied to single days it is an estimate.
Design notes
- Lower target height (4 cm instead of 10). A ridgeline works because one peak hides a couple of years behind it, not the whole stack.
- Tails are clipped where density falls below half a percent, so thin spikes don't snap off.
- A QR code on the bottom links to the exact version you are holding: the series, the reference and the view, with a short readable text beside it. When a model gets passed around a classroom, someone can always find out what it shows.
Try it at hedin.it/klimatskivor. The older time view is still available at ?vy=tid.
Get new posts: Follow on Bluesky Follow on Facebook RSS feed How?