Energy
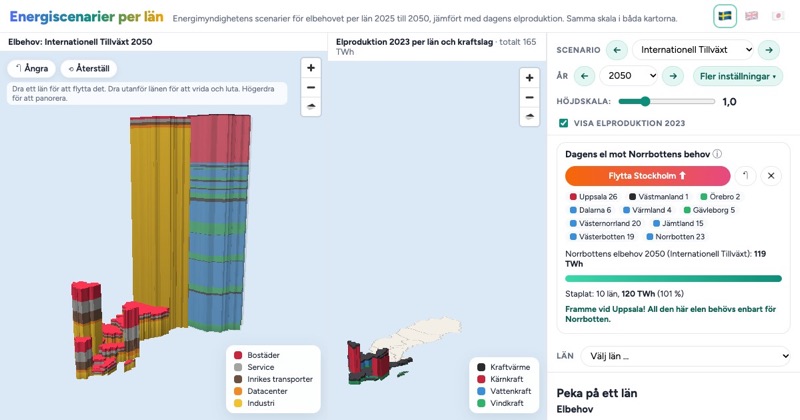
How much electricity will Norrbotten need?
The Swedish Energy Agency's scenarios for electricity demand per county, 2025 to 2050, as 3D bars next to today's production at the same scale. In the highest scenario you can stack the production of ten counties before you reach what Norrbotten alone would need.
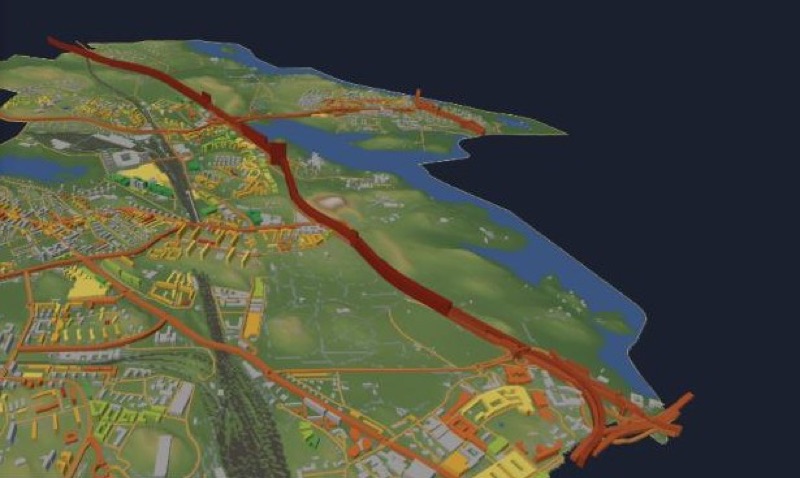
Solna's emissions as pillars of gas
The 3D map of Solna now shows greenhouse gas emissions: a 1×1 km grid from SMHI and, for every road link, one year of traffic exhaust drawn as a pillar of pure CO₂ gas at true scale.
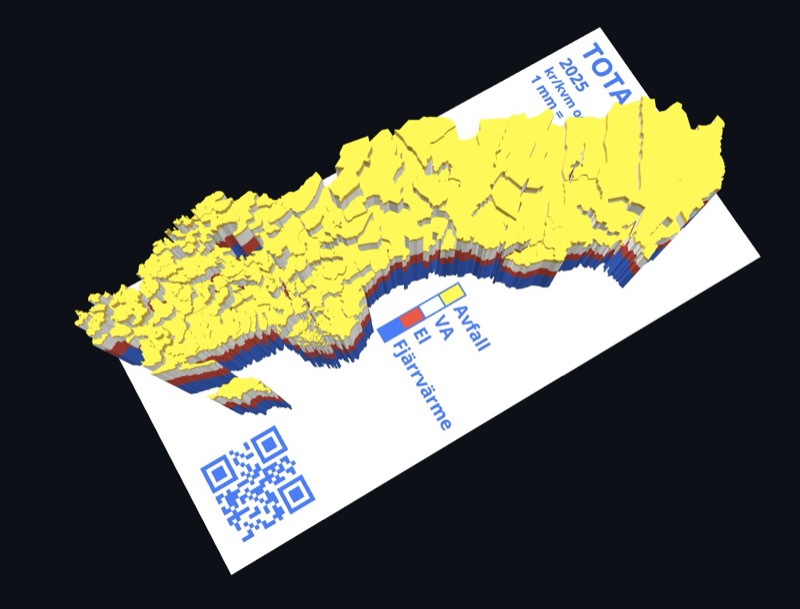
Housing costs in four colours
Thirty years of the Nils Holgersson reports as a printable map of Sweden: district heating, electricity, water and waste stacked as four coloured layers, at a fixed 1 mm per 10 kr/m².
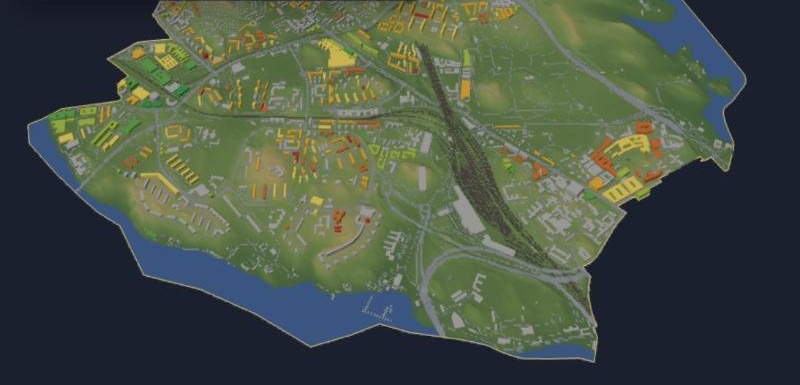
Solna in 3D: terrain, buildings, energy classes and plans
An interactive 3D map of Solna that you can also print: terrain, every building, the energy class of apartment blocks and premises, and the volumes that new detailed plans allow.
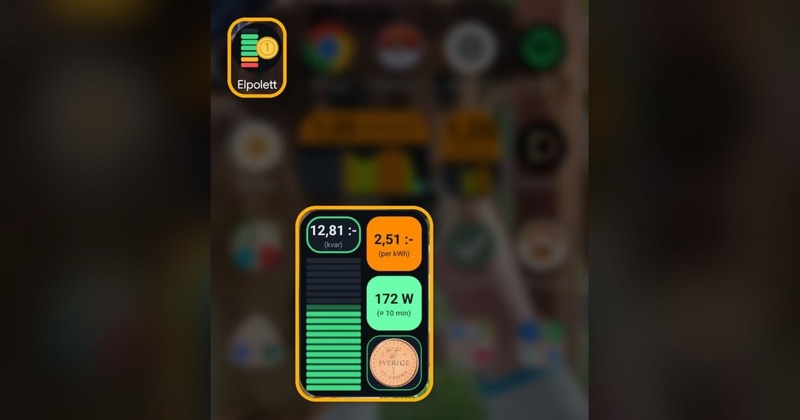
A coin meter for electricity
Elpolett borrows the design of 1950s prepaid gas meters. A column of lights shows how much electricity money is left, and one light goes out for every krona you use.