Solna's emissions as pillars of gas
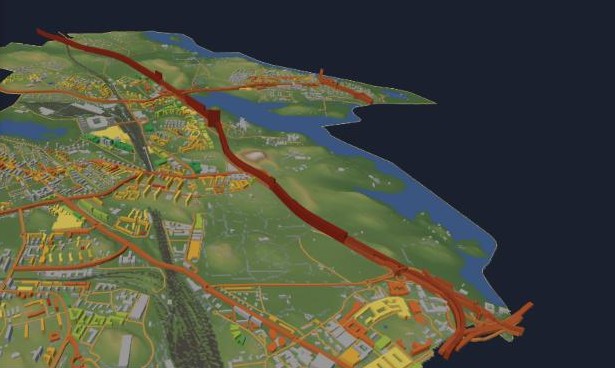
The 3D map of Solna now shows greenhouse gas emissions: a 1×1 km grid from SMHI and, for every road link, one year of traffic exhaust drawn as a pillar of pure CO₂ gas at true scale.
Solna 3D started as a printable map of terrain and buildings, and then got energy classes and new detailed plans. This week it got emissions.
Where the emissions are
The first new layer is SMHI's national emissions database, which publishes greenhouse gases on a 1×1 km grid. Each square becomes a 3D column, and you can switch between years from 1990 to 2024 and between sectors.
The numbers behind it: Solna's territorial emissions were about 205,000 tonnes CO₂e in 1990 and 99,000 tonnes in 2024, roughly half. Transport is now about three quarters of the total (74,000 tonnes), and passenger cars alone account for 51,000.
One year of exhaust, as gas
A square kilometre is still abstract, so the second layer breaks road traffic down to each road link. I took the road network from OpenStreetMap and traffic counts from Trafikverket's road database (NVDB). Where a link has been measured, it uses the measured daily traffic. Elsewhere it uses a typical value for that kind of road. Emission factors are HBEFA-level averages for a mixed fleet, and the whole model is then calibrated so the sum matches SMHI's total for road traffic in Solna (about 73,000 tonnes in 2024). The total is official. How it is split between the links is a model.
Measured links are only 373 of 1,833, but they carry about three quarters of the emissions, because they are the big roads.
Then the trick: each link's emissions for one year are drawn as a pillar of pure CO₂ gas (1.87 kg/m³) standing on the road, as wide as the road and at the same scale as the buildings next to it. On the busiest stretch of the E4 (Uppsalavägen, about 68,000 vehicles a day) that pillar is around 70 metres high. The E4 through Solna accounts for about 45% of all modelled road emissions in the municipality.
And on the printer
The print export now has a four-part option, with ground, buildings, water and CO₂ pillars as separate parts for a four-colour print, sized by default for a 256 mm print bed. The gas pillars become something you can hold next to the houses they pass.
Emissions: SMHI, Nationella emissionsdatabasen (RUS). Traffic: Trafikverket, NVDB. Roads and buildings: © OpenStreetMap contributors (ODbL).
Get new posts: Follow on Bluesky Follow on Facebook RSS feed How?