Visualization
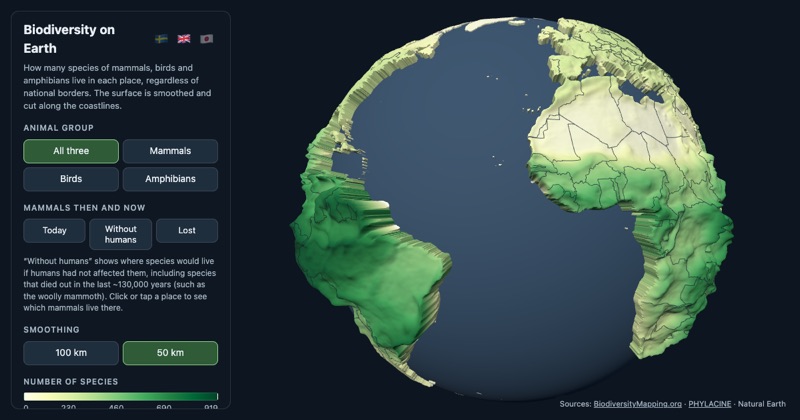
A globe of where the species are
An interactive globe where the land rises with the number of mammal, bird and amphibian species living there. It can also show which mammals would live in a place without humans, and it exports as an 8 cm two-colour 3D print.
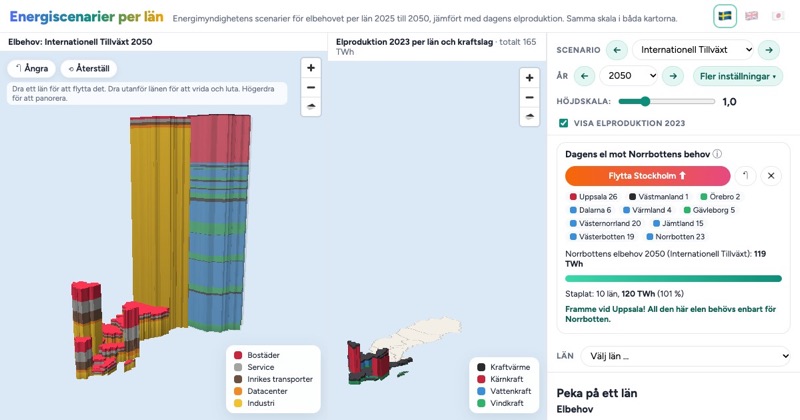
How much electricity will Norrbotten need?
The Swedish Energy Agency's scenarios for electricity demand per county, 2025 to 2050, as 3D bars next to today's production at the same scale. In the highest scenario you can stack the production of ten counties before you reach what Norrbotten alone would need.
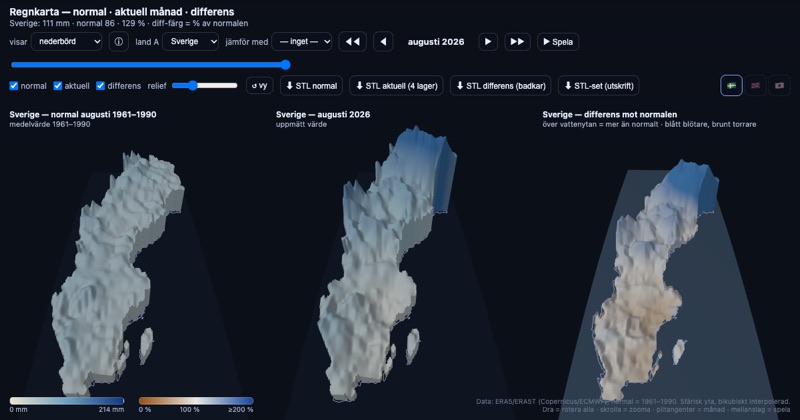
A rain map that updates itself
Monthly precipitation as 3D surfaces on the curved Earth, side by side with the 1961–1990 normal. The Swedish map now refreshes itself every month as soon as new ERA5 data is out.
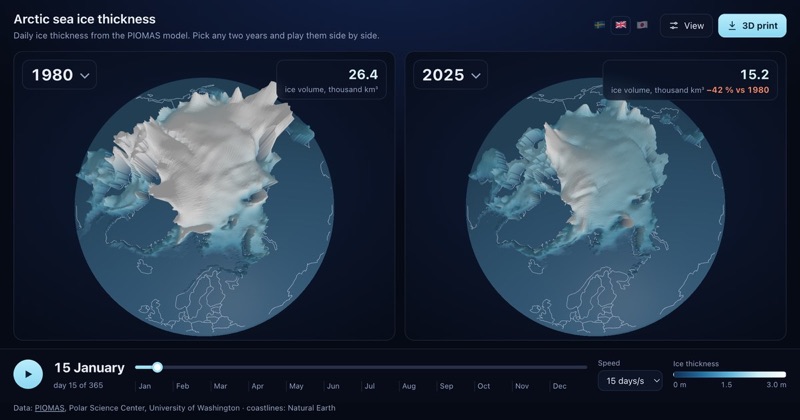
Arctic sea ice, any two years since 1979
Two globes side by side showing daily Arctic sea ice thickness from PIOMAS. Pick any two years from 1979 to 2025, play them day by day, and print the ice as a 3D puck.