A rain map that updates itself
Monthly precipitation as 3D surfaces on the curved Earth, side by side with the 1961–1990 normal. The Swedish map now refreshes itself every month as soon as new ERA5 data is out.
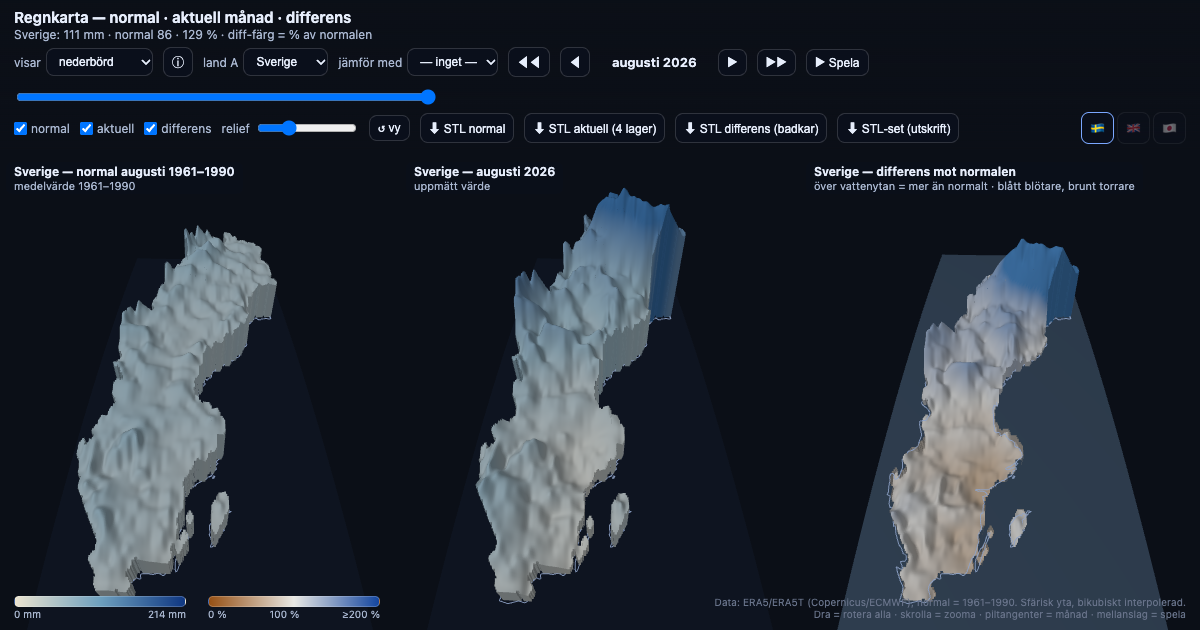
"Was that a wet month?" is a surprisingly hard question to answer by feel. The rain map answers it by putting three views of a country next to each other: the normal for that month (1961–1990), the actual month, and the difference. All three are drawn as 3D surfaces on the Earth's real curvature, one bar per 0.25° grid cell from the ERA5 reanalysis.
In the difference view, zero is a water surface. Places that were drier than normal sink below it, wetter places stick up. You can drag to rotate all panels at once, play through the months since 2016, or put two countries side by side on a shared height scale.
It keeps itself current
Sweden is now updated automatically. Every morning a small script checks whether the Copernicus Climate Data Store has published a new month (usually around the 5th–6th). When it has, the map is rebuilt, published and checked. September 2026 went live on 7 October without anyone touching it.
So what did September look like? Averaged over Sweden, about 74 mm of rain against a normal of about 77 mm, so roughly 95% of normal: an ordinary month. The year as a whole was anything but ordinary. April got about half its normal rain and June about one and a half times.
Temperature is in the same tool. September 2026 was about 1.9 °C warmer than the 1961–1990 September normal. That was only the fifth warmest September in the series. In fact, all eleven Septembers from 2016 to 2026 were warmer than that normal.
Rain you can hold
Like most of my tools, the map can be exported for 3D printing: either the month in four colour layers (0–50%, 50–100%, 100–150% and over 150% of normal), or the difference as a "bathtub" whose rim is the normal level, with dry areas sunk below it and wet areas rising above.
Comments? Reply on Bluesky @hedin.it.
Get new posts: Follow on Bluesky Follow on Facebook RSS feed How?