What worked at ForskarFredag: half-globes beat paragraphs
Notes from showing 3D-printed climate models to the public at ForskarFredag 2026. The Arctic sea ice half-globes needed no explanation, the layered Sweden models needed a legend, and our printed info cards had far too much text.
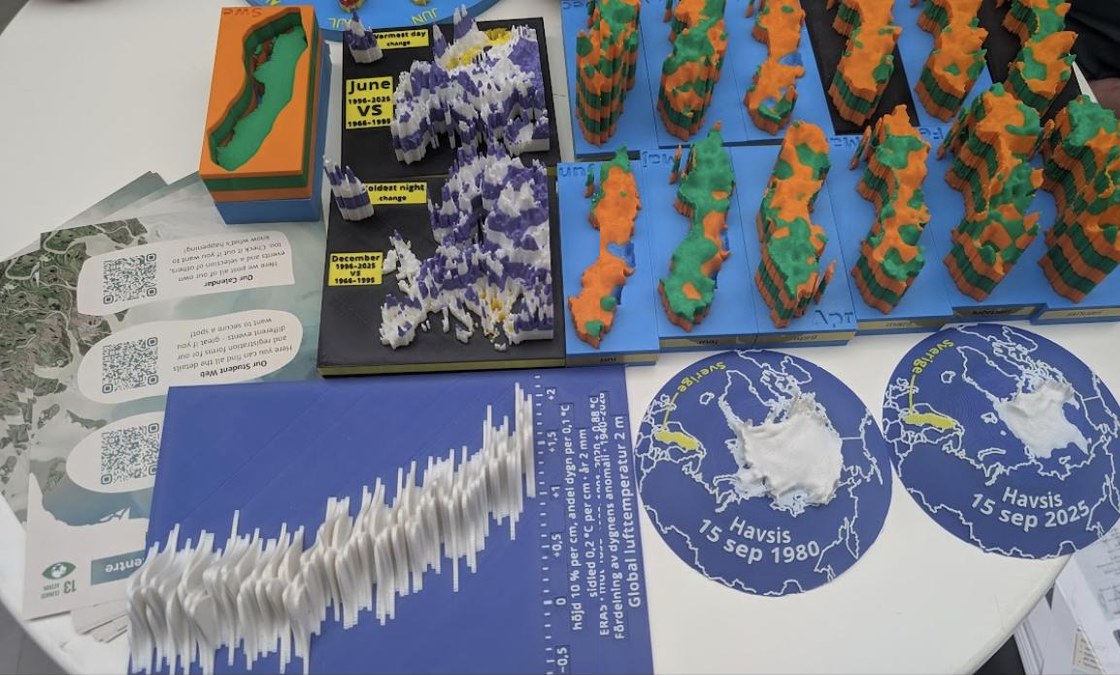
On 25 September we brought a table of 3D-printed climate models to ForskarFredag, the Swedish researchers' night. It was a good test of what printed data actually does in front of a walk-up audience: people who have a minute or two, no instructions, and no reason to be polite to a chart.
What we brought:
- Sweden models of temperature change, one layer per period (the same set as earlier years, this time without the boxes that used to hide them).
- Three Europe models: mean change, the warmest June-day anomalies and the coldest December-night anomalies.
- Sweden as a clock: one month at each hour position.
- Half-globes of Arctic sea ice for September 1980 and September 2025, from the sea ice thickness tool.
- A ridgeline stack of daily global temperature anomalies since 1940, from Klimatskivor.
What worked
The sea ice half-globes needed no explanation at all. Two Arctics side by side, same scale, and people simply got it. In the PIOMAS model the Arctic held about 16,000 km³ of ice in September 1980 and about 4,000 km³ in September 2025, roughly a quarter. You don't need to say the number; the two objects say it.
I think the reason is that the encoding is literal. Ice is shown as ice, on a globe, where the Arctic is. There is nothing to decode.
What didn't, quite
The layered Sweden models worked, but raised the question "what do the layers mean?" Anything that uses height or layers for something other than height needs its legend on the object, or at least on a small card next to it. This is also an argument for the QR code on the underside that the newer models carry.
Our info cards had too much text. Fine for a classroom, wrong for an event where people stop for ninety seconds. Next time: one sentence and one number per model.
Next
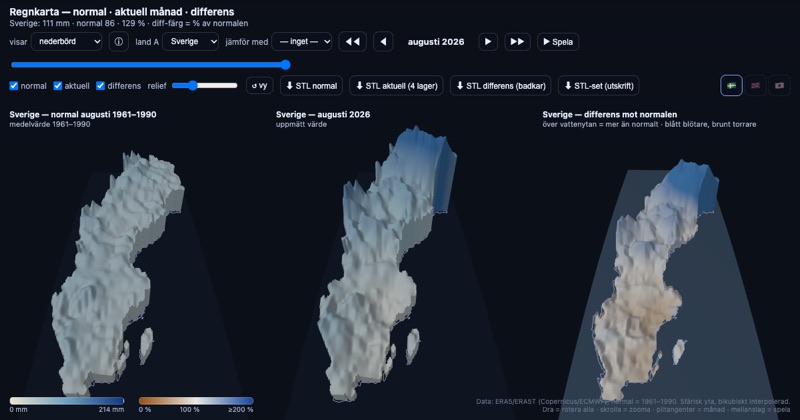
- A family of Nordic models at the same scale, showing topography, precipitation and temperature, so visitors can look for the connections themselves.
- Questions printed next to the models ("which month has warmed most?"), and maybe a puzzle format where solving a task gives you a code to a lock, so that the challenge is tied to reading the data rather than to guessing.
- At least two geography teachers were interested, so social-science teachers may be a good audience to talk to.
Comments? Reply on Bluesky @hedin.it.
Get new posts: Follow on Bluesky Follow on Facebook RSS feed How?