Climate
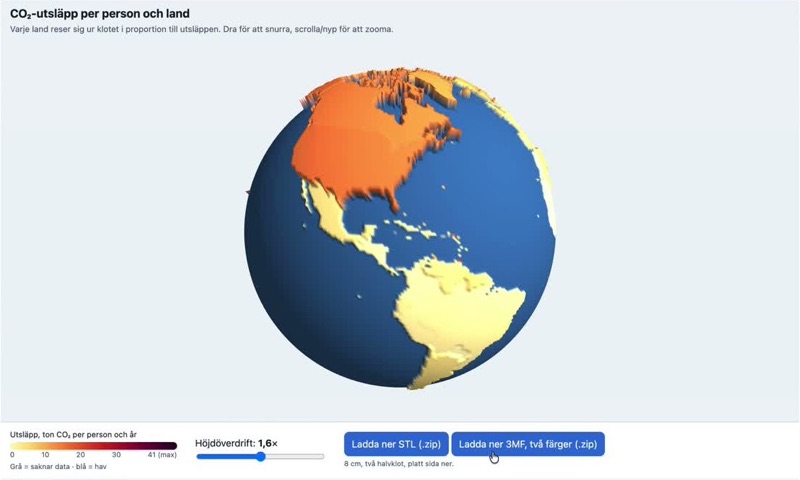
A printable globe from one prompt
At a teacher training day at Vetenskapens hus I showed how a free AI chat account turns a climate dataset into a 3D-printable globe in about four minutes. What that means for teaching with physical data.
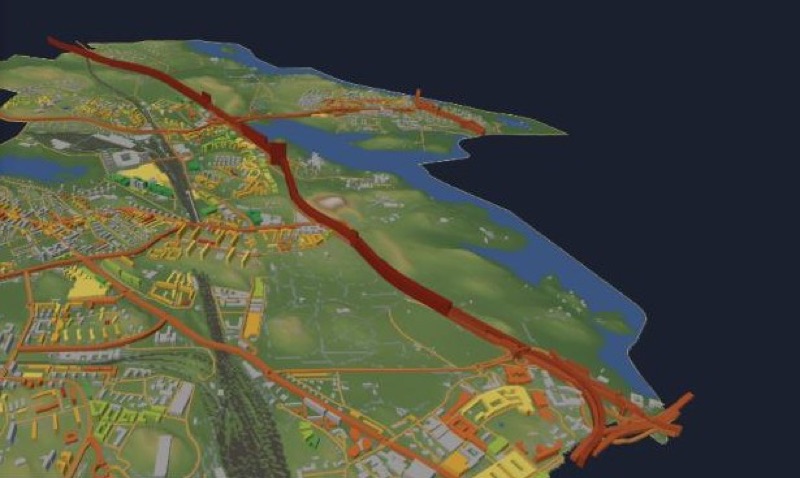
Solna's emissions as pillars of gas
The 3D map of Solna now shows greenhouse gas emissions: a 1×1 km grid from SMHI and, for every road link, one year of traffic exhaust drawn as a pillar of pure CO₂ gas at true scale.
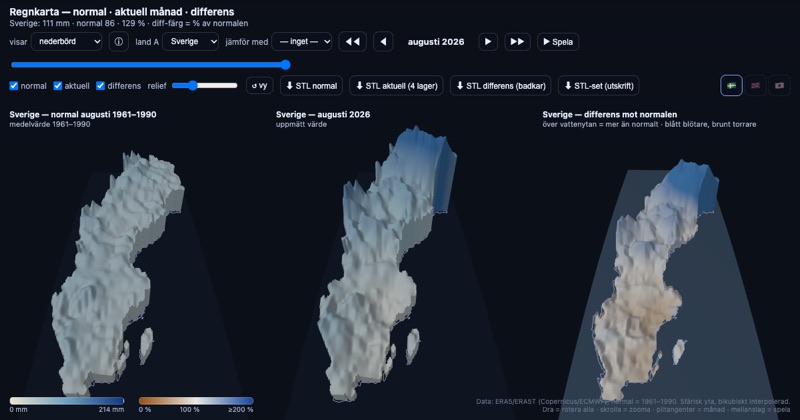
A rain map that updates itself
Monthly precipitation as 3D surfaces on the curved Earth, side by side with the 1961–1990 normal. The Swedish map now refreshes itself every month as soon as new ERA5 data is out.
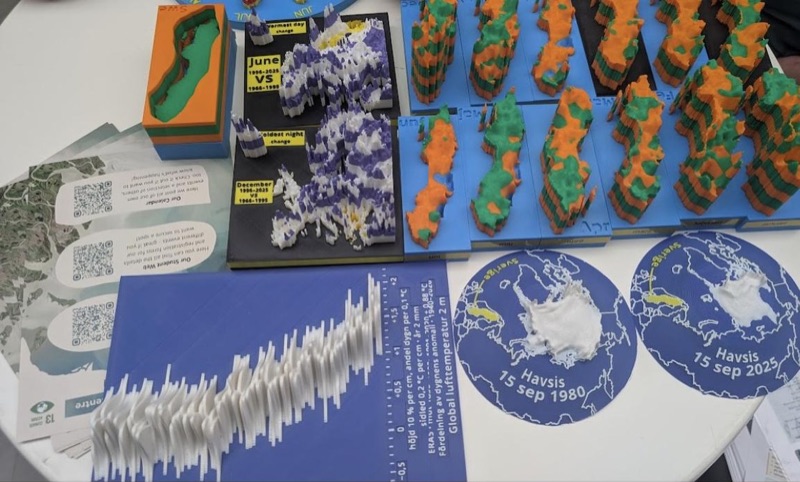
What worked at ForskarFredag: half-globes beat paragraphs
Notes from showing 3D-printed climate models to the public at ForskarFredag 2026. The Arctic sea ice half-globes needed no explanation, the layered Sweden models needed a legend, and our printed info cards had far too much text.
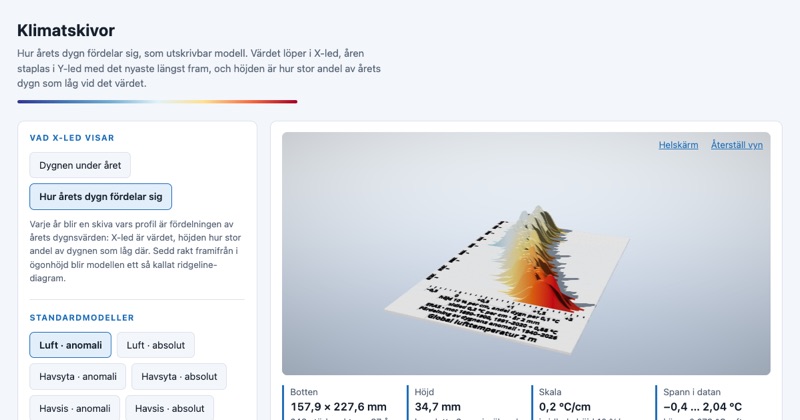
A year of global temperature as a printed disc
Klimatskivor turns every year since 1940 into a printable disc showing how its days were distributed against pre-industrial temperature. It's a ridgeline chart you can hold, with a QR code on the bottom that links to the exact model.
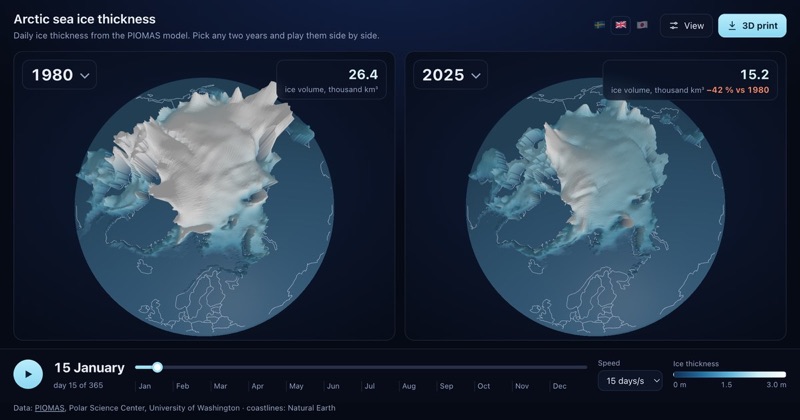
Arctic sea ice, any two years since 1979
Two globes side by side showing daily Arctic sea ice thickness from PIOMAS. Pick any two years from 1979 to 2025, play them day by day, and print the ice as a 3D puck.
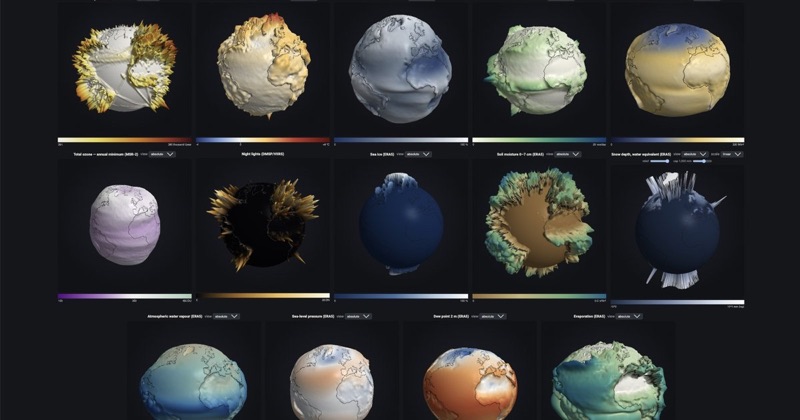
Printing climate globes in two halves
Colleagues asked for large printed climate globes. Making that work meant splitting the globe at the equator, adding a peg hole, and capping the extremes.