Printing climate globes in two halves
Colleagues asked for large printed climate globes. Making that work meant splitting the globe at the equator, adding a peg hole, and capping the extremes.
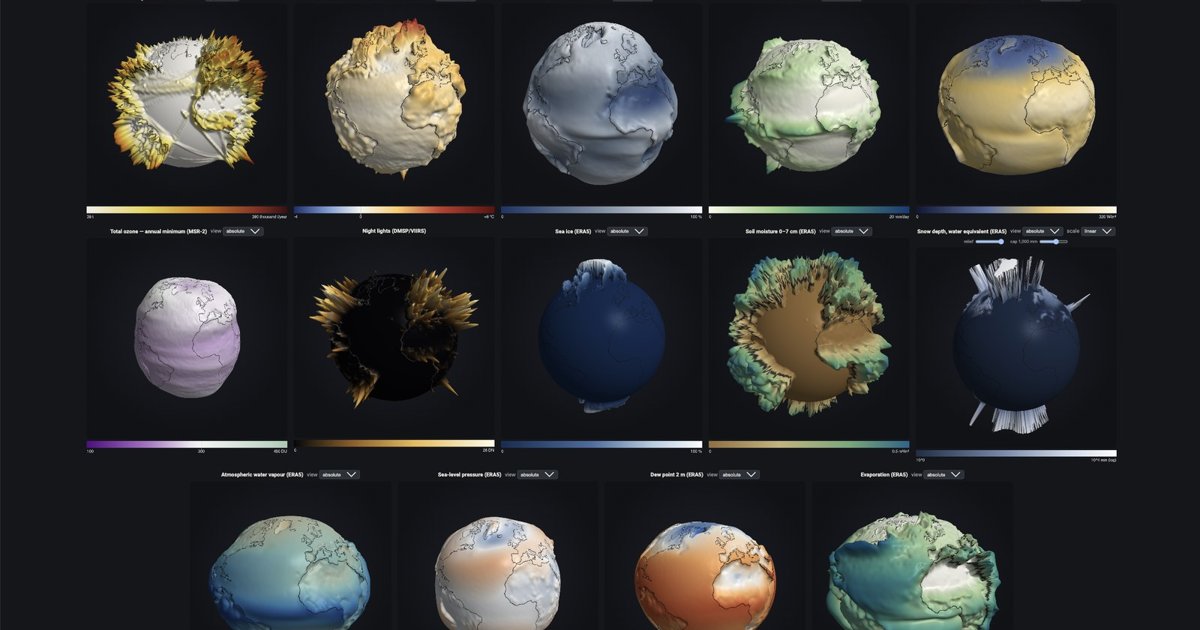
On the climate globes, the relief shows the difference between two 30-year climate periods (1995–2024 versus 1961–1990, from ERA5): warming or wetter becomes mountains, cooling or drier becomes valleys. Up and down use the same scale, so a millimetre means the same thing in both directions.
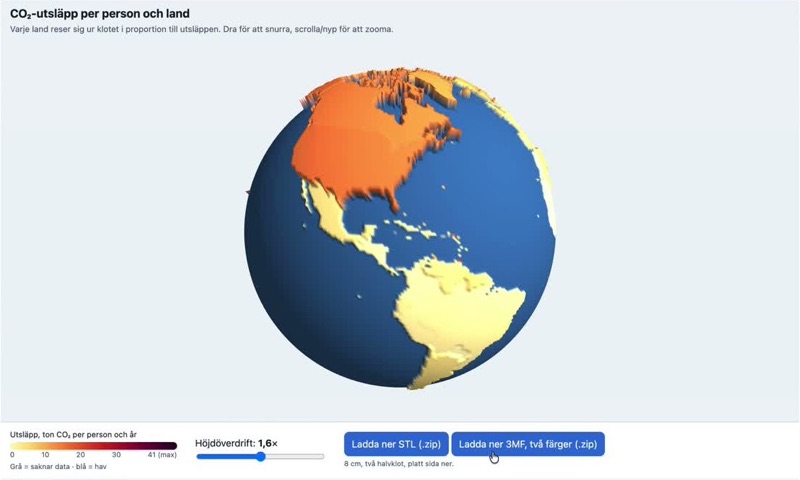
Colleagues wanted four of them in print, larger than before: change in precipitation (which grows a striking "cockscomb" along the tropical rain belt), energy use per capita, 30-year temperature change, and CO₂ per capita. A large sphere doesn't fit on an ordinary printer, so this round of work was mostly about manufacturing:
- Split at the equator. The export now writes two hemispheres at print size, each with a flat face that sits on the build plate.
- Peg hole. The southern half can get a hole of any diameter (2 cm by default), so the globe can sit on a stand. A bug here made the STL silently non-watertight, which is the kind of error you only discover after eight hours of printing.
- Caps and top layers. A few extreme values (tiny, rich countries per km², for example) would turn into needles that snap off. A height cap flattens them, and whatever the cap cuts off gets its own colour layer so the information isn't hidden.
The same export options now work on the OWID explorer, which puts over a thousand Our World in Data series on a globe.
There's also a new stripped-down demo mode for phones and exhibitions: just the globe and a play button, with the whole setup in the link.
Comments? Reply on Bluesky @hedin.it.
Get new posts: Follow on Bluesky Follow on Facebook RSS feed How?