Solna in 3D: terrain, buildings, energy classes and plans
An interactive 3D map of Solna that you can also print: terrain, every building, the energy class of apartment blocks and premises, and the volumes that new detailed plans allow.
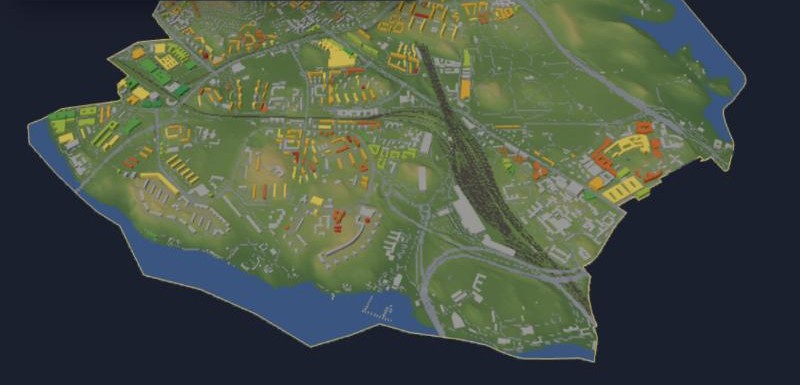
Solna 3D is an interactive 3D map of Solna, just north of Stockholm, built on open data: terrain from elevation data, and about 3,500 buildings with footprints and heights from OpenStreetMap. You can pick the whole municipality, a district, or draw your own rectangle, and export it for 3D printing.
Energy classes, building by building
This week a new layer went public: the energy class from each building's energy declaration, from Boverket's register. Boverket gave permission to show it at building level for apartment blocks and commercial premises, with Boverket as the source. Detached houses are left out entirely.
That covers 1,369 declared addresses in Solna: 1,109 apartment blocks and 260 premises. The most common class is E (543 addresses, about 40%). Only 113 (about 8%) reach A or B, and 24 are in class G. Seeing it in 3D makes the pattern spatial: you can see which neighbourhoods are new and efficient and which older blocks are waiting for renovation.
What the new plans allow
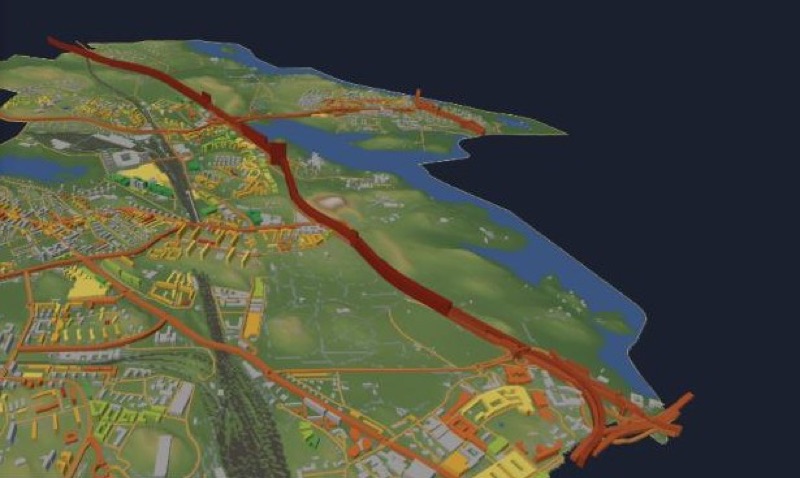
A second new layer shows the future. It reads Solna's digital detailed development plans from Lantmäteriet's national platform (14 plans so far) and draws the building volumes they permit as clear red shapes next to today's buildings. A small job checks for new plans every month.
Printed in colour, straight from the browser
The export used to give a zip of STL files that you then had to colour one by one in the slicer. Now it can also write a 3MF project where buildings, land, water and streets are already separate, pre-coloured parts, so a multi-material printer like a Bambu can print it more or less directly.
The point is the same as in my other data-physicalisation work: a printed piece of your own neighbourhood is something people pick up, turn around and argue about, in a way they rarely do with a map on a screen.
Energy data: Boverket, energy declaration register. Buildings and boundaries: © OpenStreetMap contributors (ODbL).
Comments? Reply on Bluesky @hedin.it.
Get new posts: Follow on Bluesky Follow on Facebook RSS feed How?